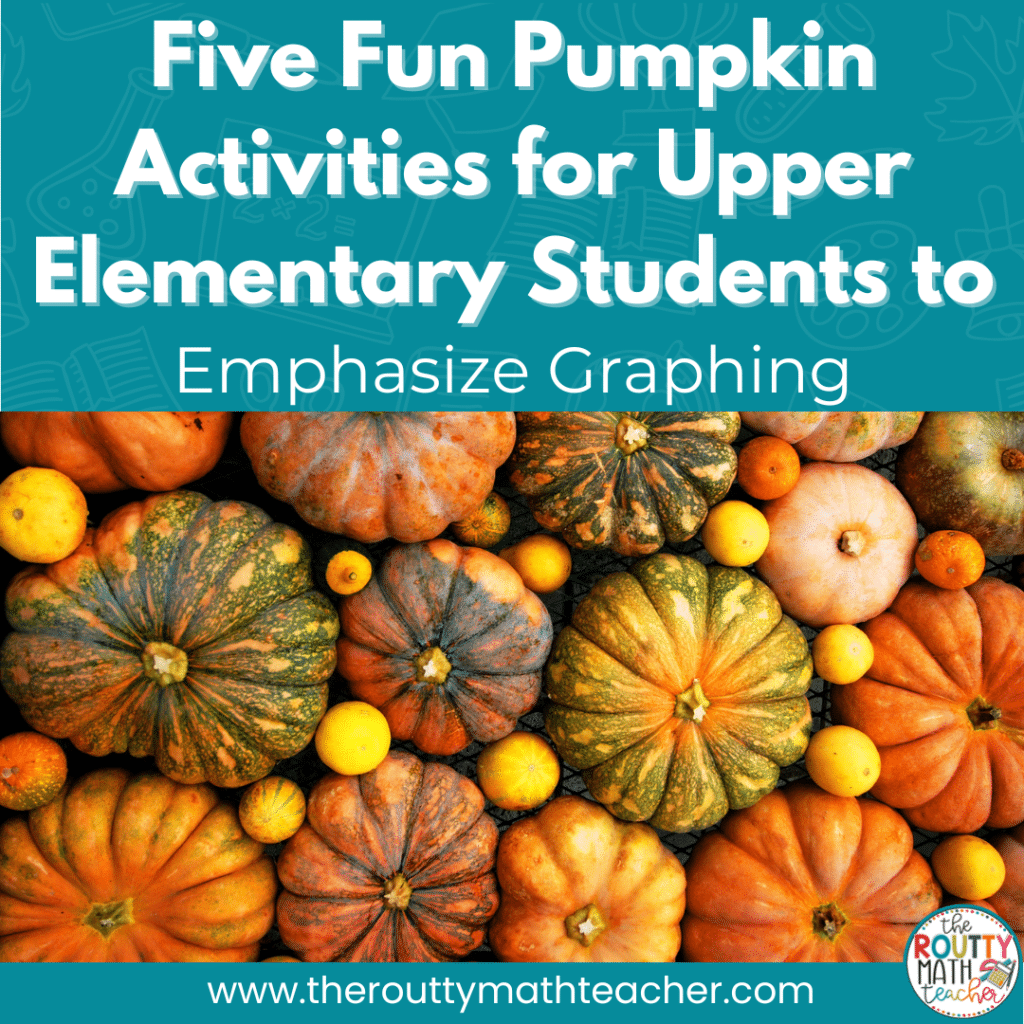
As an upper elementary school teacher, there aren’t many opportunities to celebrate the seasons with thematic units and activities. Well, in today’s post I’m going to help you make the fall season come alive in your classroom with pumpkin activities for upper elementary students.
As an upper elementary teacher, I felt like a hamster on a hamster wheel trying to teach and reinforce 30 to 40 math standards.
An average school year has about 36 weeks. Even if I covered one standard a week, it was a challenge to complete all of the standards before the state math assessment in April.
After a few years of running the hamster wheel, I started looking for ways to teach some of the Spring content and skills earlier in the year.
Graphing Year-Round
One of the strategies I used to accomplish this goal was to teach my graphing skills, one week at a time, during the fall semester. Each week, usually on a Monday, I did a mini-lesson to teach a new type of graph and then we collected data and graphed it.
With this strategy in mind, I created an opportunity to celebrate the fall season and integrate some seasonal graphing activities at the same time. In this post, I share five pumpkin activities for upper elementary students where students collect and display data with a variety of graphs.
Pumpkin Activities for Upper Elementary Students
The following steps describe how to collect, organize, and display data for the pumpkins. Be sure to download the data collection card and graphing activities using the form at the end of this post.
1. Distribute the Pumpkins
For this set of tasks, students will need access to pumpkins. I recommend getting small pumpkins for individual students/pairs or getting larger pumpkins for small groups of three to four. (Short on funds? Consider asking your PTA/PTO to purchase the pumpkins or ask parents to donate them. You may even be able to go to a local grocery store or farmer’s market and ask them to donate some for your class.)
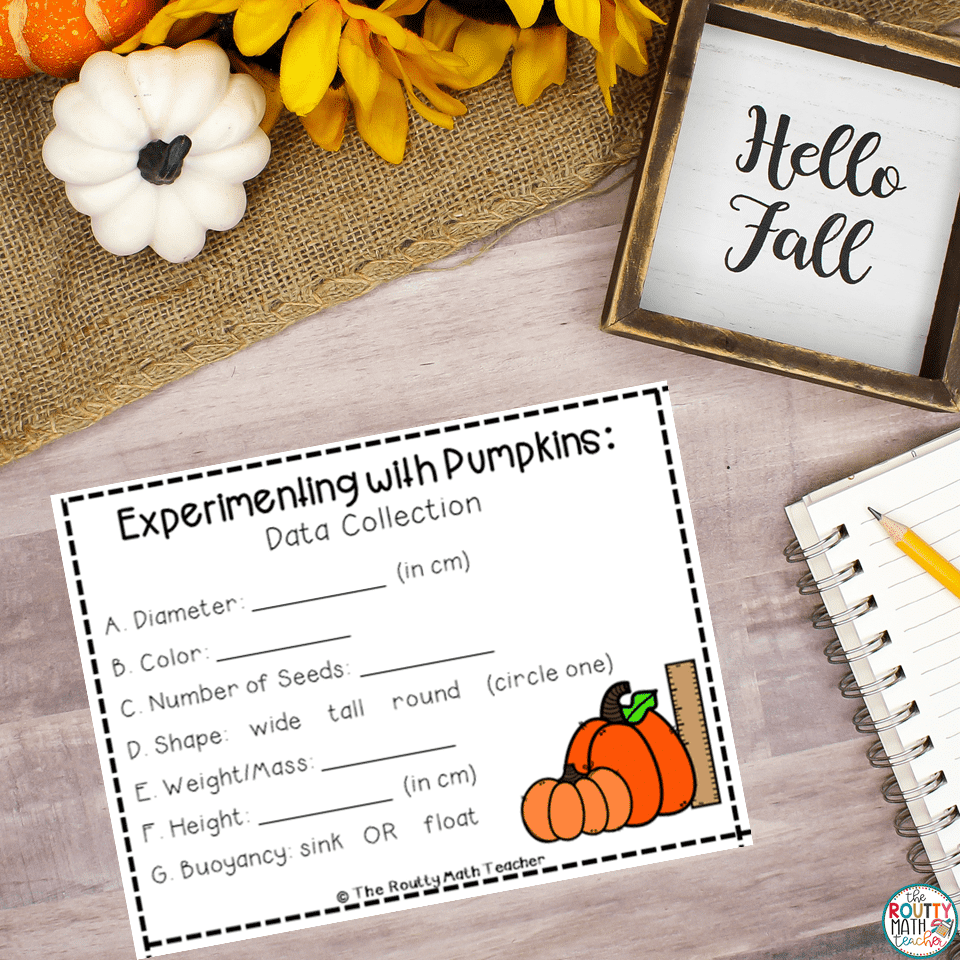
2. Collect Data About Each Pumpkin
After students receive a pumpkin, they need to collect the following information about their pumpkin: diameter, color, number of seeds, shape, weight/mass, height, and buoyancy. Note: The activity download for this post includes a collection card (see the picture above); however, listing the information on an index card or in a math notebook would work well too.
3. Combine and Share Class Data
Once students have collected the data about their pumpkin, combine the class’s data and share it with the students. One way to do this is to assign seven small groups the data to sort and organize. (Consider giving each group a specific number of data collection cards. Then, allow them time to record the data for one of the attributes, like diameter, color, shape, weight/mass, height, and buoyancy. Finally, tell students to rotate the set of data to the next group.)
This is an excellent opportunity to discuss how to organize data. This activity does include an opportunity for students to create a stem-and-leaf plot, as well as, a frequency table to display data. However, orchestrating a discussion about presenting data using an organized list or table would be helpful for the students.
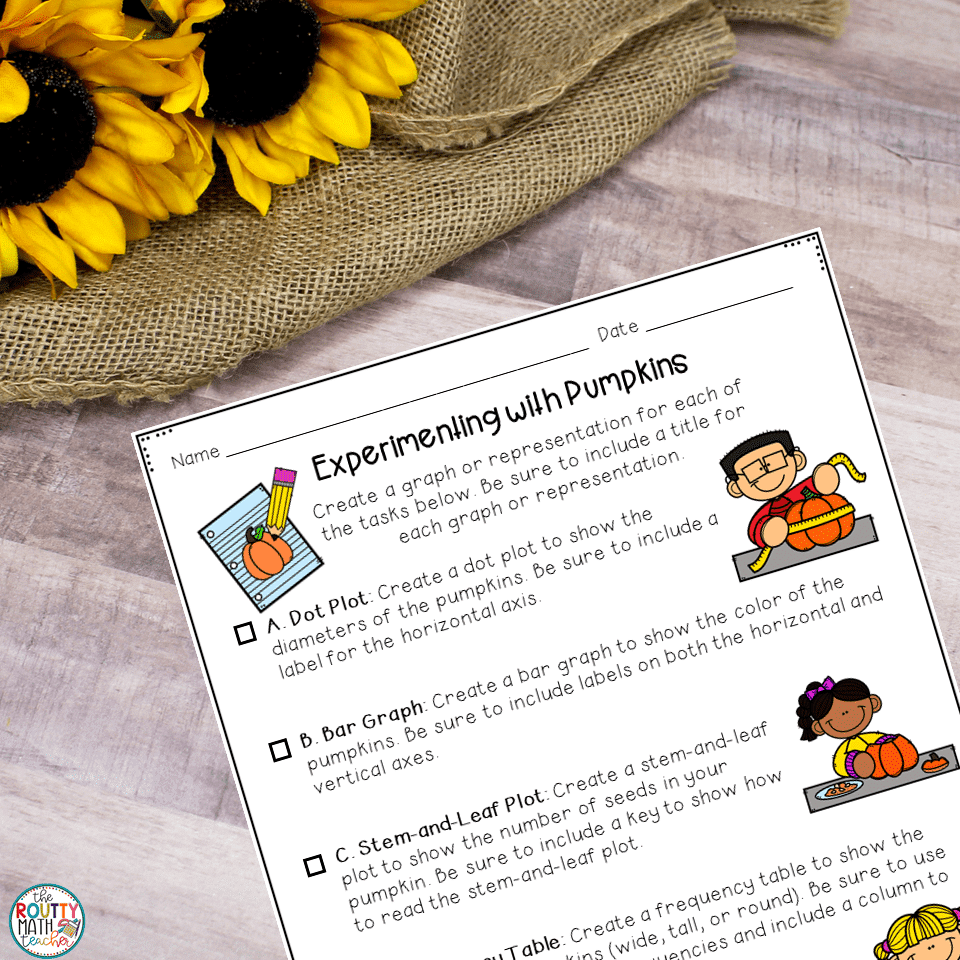
4. Graph the Data
Once the data is sorted and organized, make copies of the data sheets for students to use to represent the data. (Consider providing small groups of students with a folder of data to use to create their graphs). Students will then create the following representations with the class data: dot plot (as known as a line plot), bar graph, stem-and-leaf plot, frequency table, scatterplot, and circle graph.
This activity represents many of the graphs and representations included in the standards for upper elementary students; however, students may need to be introduced to some of them before beginning this activity.
Extension: The data to show whether the pumpkins have buoyancy (ability to sink or float) is included on the collection card but not the activity sheet. The buoyancy of the pumpkins can be tested using a large tank of water (like an aquarium) and represented with a pie chart. This would be an excellent challenge activity for students who are fast finishers or who need an extension.
5. Display the Data
After students have created the graphs, have them place them in a construction paper bound book foldable with the title, “Experimenting with Pumpkins.”
Other Ideas to Experiment With
A. While the pumpkins may have an expiration date, the activity does not. You may want to consider collecting and organizing the data early in the month and then giving students time to work on the graphs throughout the season. If your students are unfamiliar with the graphs, you may want to introduce a new graph on Monday and then give students time to work on creating the graph.
B. Use the pumpkin data to reinforce measures of central tendency (mean, median, mode) and range.
C. If your students are already familiar with the graph types, use the activity like a menu and allow students to complete the tasks to demonstrate mastery. Create a few folders of data and place them in a central location where students can use them as needed.
D. Assign groups of students one graph to create and display them in the hallway.
Let’s Celebrate the Season
It’s time to get excited about fall y’all and experiment with pumpkins. I hope these activities help you and your students celebrate the season and reinforce skills related to data, graphing, and statistics. Be sure to grab a free copy of the pumpkin activities for upper elementary students using the form below.
Looking for other graphing activities? Check out this blog post.
Sound Off!
How do you celebrate the season with your students? Respond in the comments section below.

